- Date added:
- Oct 08, 2021 | Last update check: 1 minute ago
- Integrations:
- —
- Licence:
- Trial
- Runs on:
- Windows 10 64-bit
Power BI (Business Intelligence) is an analytics software suite by Microsoft that provides standardized data organization for 3D models and data created in BIM software. It allows the user to view the data exported from other sources together in interactive and updatable graphics to communicate design information better. Power BI has integration with a variety of BIM software such as BIM 360, Navisworks, Revit and BIM Track, and can be leveraged to provide intelligent dashboards to inspect the construction-related data exported from each software. It provides features such as custom dashboards, data modelling, associating, sorting and mining. Power BI allows users to gather data from any source and summarize the findings into a simple report without the need for programming.
It comes with different versions, some of which can be downloaded for free from the Microsoft website, namely: Power BI Desktop, Power BI Service (SaaS, cloud-based), Power BI Mobile Apps, Power BI Gateway, Power BI Premium, Embedded (integration with Azure) and Power BI Visuals Marketplace.
Features:
- Dashboards: Create custom dashboards by bringing all project data from different software into a single screen. The user can choose from a wide range of pre-built visual interfaces or create custom visuals to illustrate the data. The dashboards can be directly printed.
- Natural Language Q&A: Create custom and interactive reports with the option of adding a “Question” button giving the reader the freedom of asking questions in plain English to carry out a random analysis.
- Data Analytics: Power BI is equipped with DAX formula language which provides more than 200 functions to help the user perform computational routines on the data and create analytical data models.
- Excel integration: The user can easily connect the Excel data – queries, data models and reports to Power BI with a single click to create Pivot tables, charts and other graphics.
- Custom KPIs: Define custom KPIs (Key Performance Indicators) to compare and benchmark the performance across multiple construction projects.
Typical workflow:
Viewing clash metrics with Navisworks and Power BI
- Export the Revit model to Navisworks Manage.
- Perform clash detection in Navisworks.
- Manage and organize the clashes in the Clash Detective tool.
- Use the custom Clash Data exporter add-in to access the Clash Detective and export the results file to HTML/XML format which can be viewed in Excel.
- Save the XML file in Excel for exporting to Power BI.
- In the Power BI environment, open the different Excel files and go to the Visualization tab to select from an array of graphics (charts, tables etc.).
- Create the desired visualization and export it to PDF.
Linking Revit file to BIM 360 through Power BI
- Export the Revit model into MS Access (.mdb file) using Revit DB Link which is available on the Autodesk website as a free add-in.
- To export a Revit schedule, export the file into .txt format and process it through MS Excel to open it in Power BI.
- Create Revit model reports using Autodesk Model Checker for Revit and export it to .xls format.
- The 2D plans can also be exported into an image format.
- In the Power BI portal, select Get Data from the top toolbar and select the desired program from the list.
- Select the desired information from the Display Items of the Navigator dialogue box.
- Select the desired details from the Fields tab in Power BI.
- Go to the Visualization tab to select from an array of graphics (charts, tables etc.).
- Link the data directly to BIM 360 by publishing the created visualization to “My Workspace”. This allows the user to publish the file to the Web.
- Copy the embed code URL generated in Power BI.
- In the BIM 360 Insight portal, click on Customize on the top right corner and open Card Library and select the Power BI Partner Card.
- Click on Configure Card and paste the copied URL to link the Revit model data into it.
Power BI integration with BIM Track
- Add BIM Track as a data source in Power BI using the Settings tab to configure the IM Track dashboard template.
- To compare KPIs of different projects use the Multi-project monitoring page.
- To organize the issues by discipline, zone, priority etc., use the Issues Segmentation page.
- Monitor the project health by visualising the issues by discipline.
About Microsoft
Microsoft Corporation is a US-based developer of computer technology systems, electronics and software. Founded by Bill Gates and Paul Allen in 1975, Microsoft has developed from a basic computer programming language to the multi-national company it is now. Its best-known products include the Microsoft Windows operating systems, Microsoft Office Suite, Internet Explorer, Microsoft Edge web browser and Microsoft Surface personal computers.
Gallery
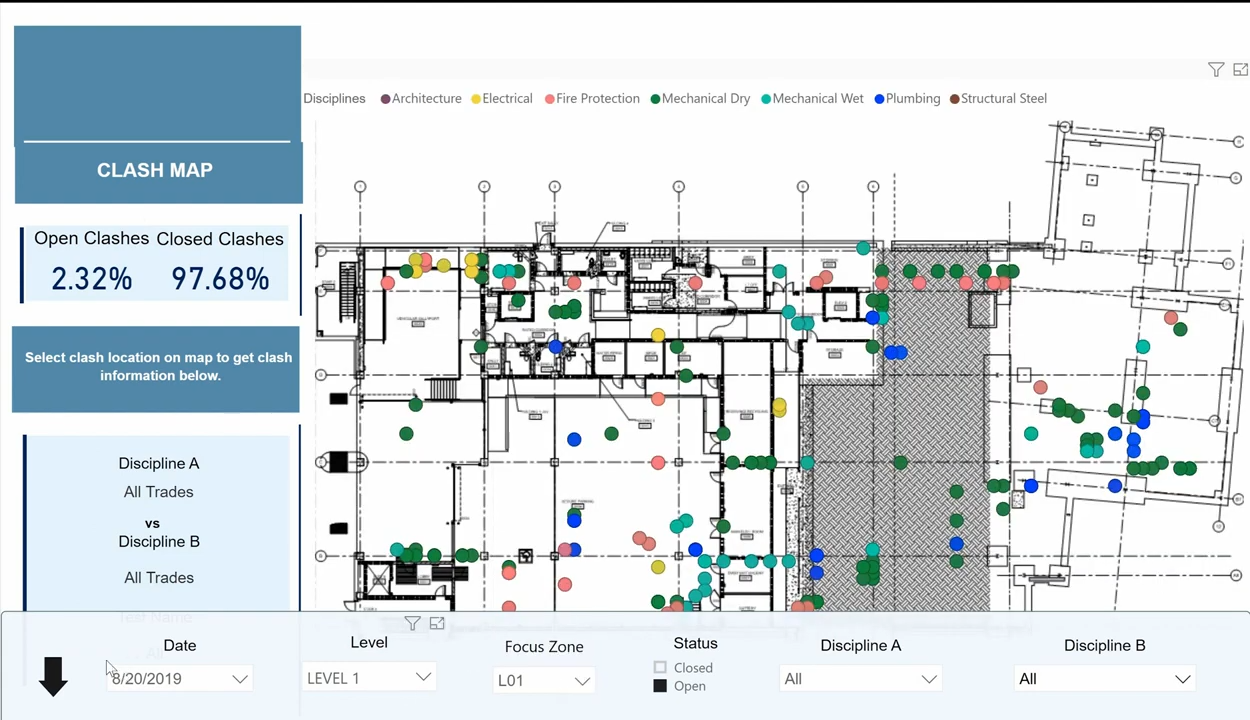
Visualize clash metrics with Navisworks and Power BI – Clash map dashboard. ©Carlo Caparas
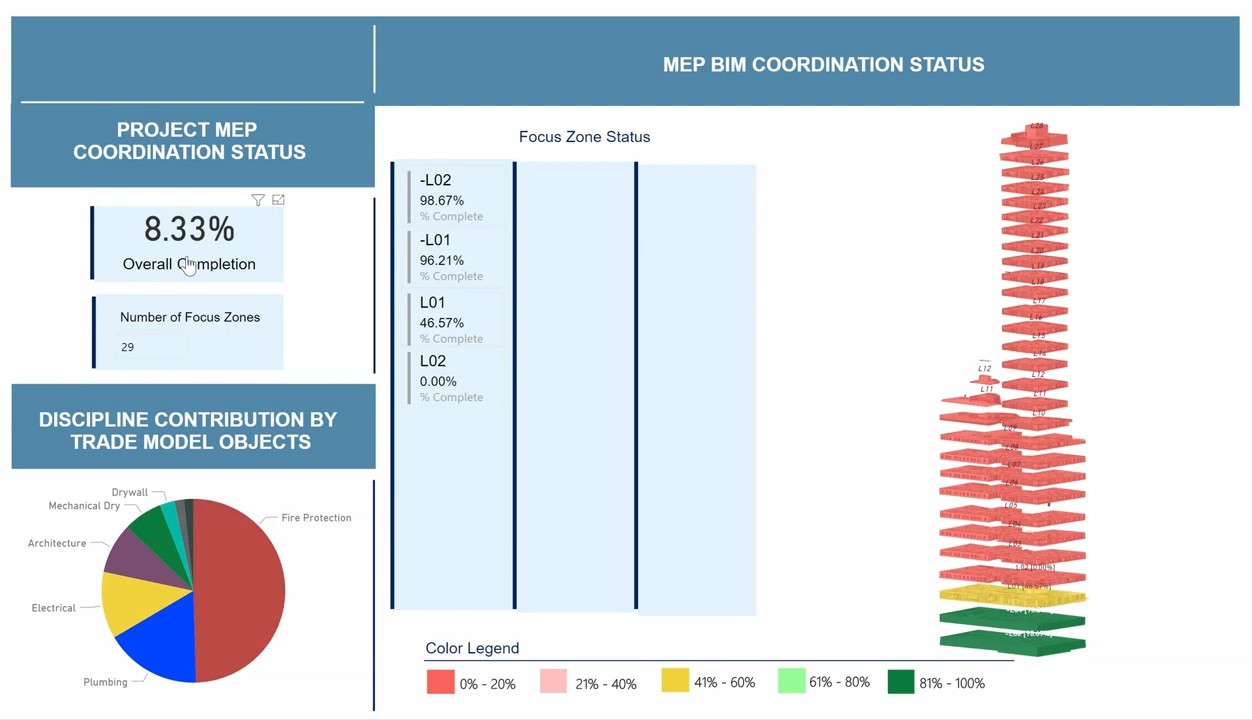
Visualize clash metrics with Navisworks and Power BI – Project focus zone progress report. ©Carlo Caparas
Visualize clash metrics with Navisworks and Power BI – Power BI project summary. ©Carlo Caparas
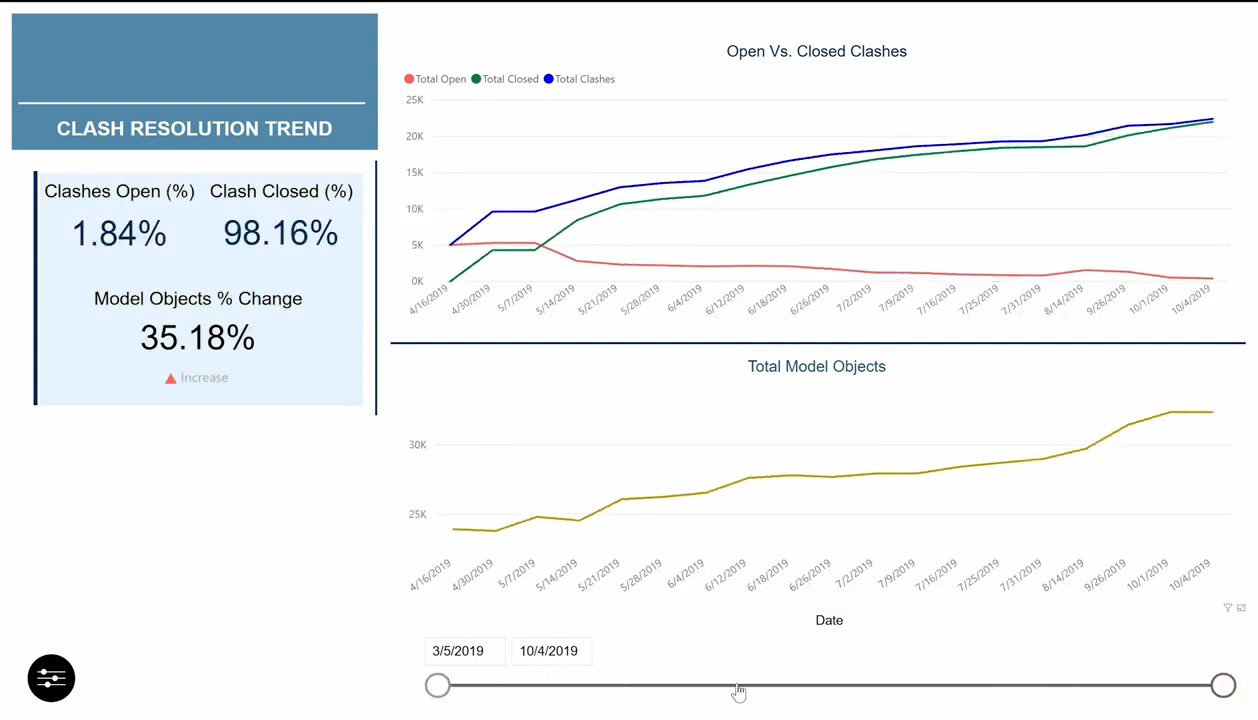
Visualize clash metrics with Navisworks and Power BI – Trade partner clash details report. ©Carlo Caparas
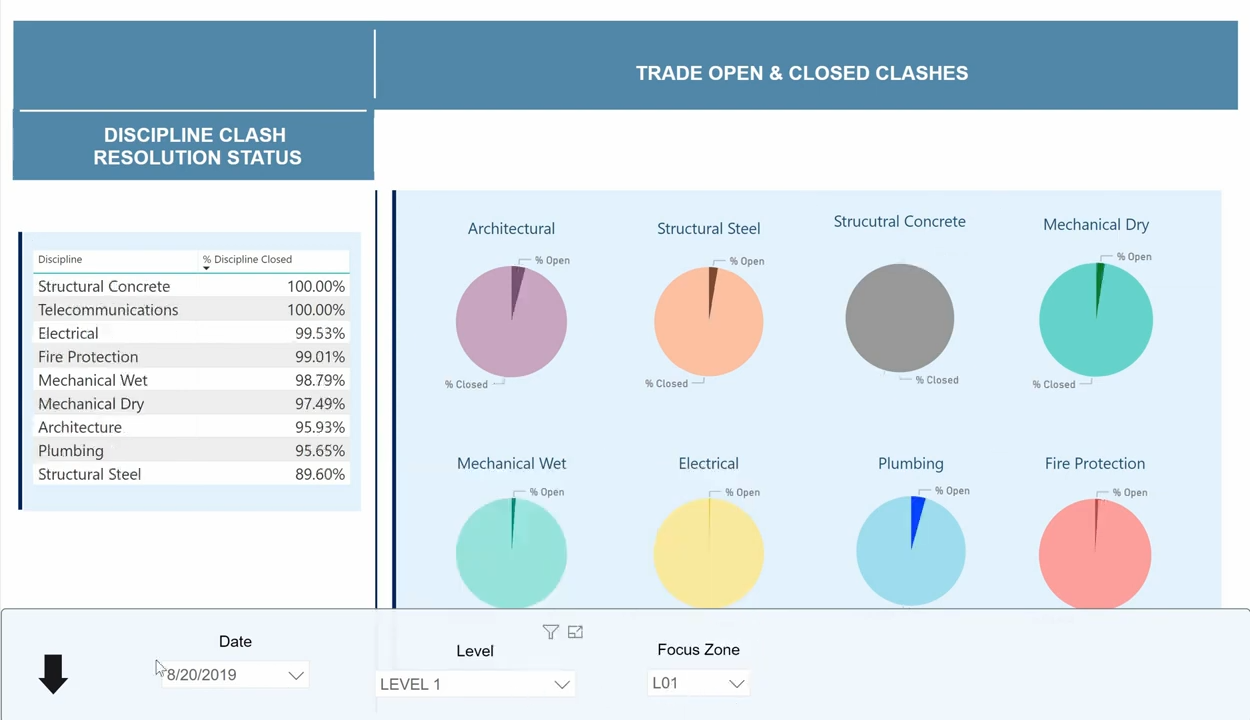
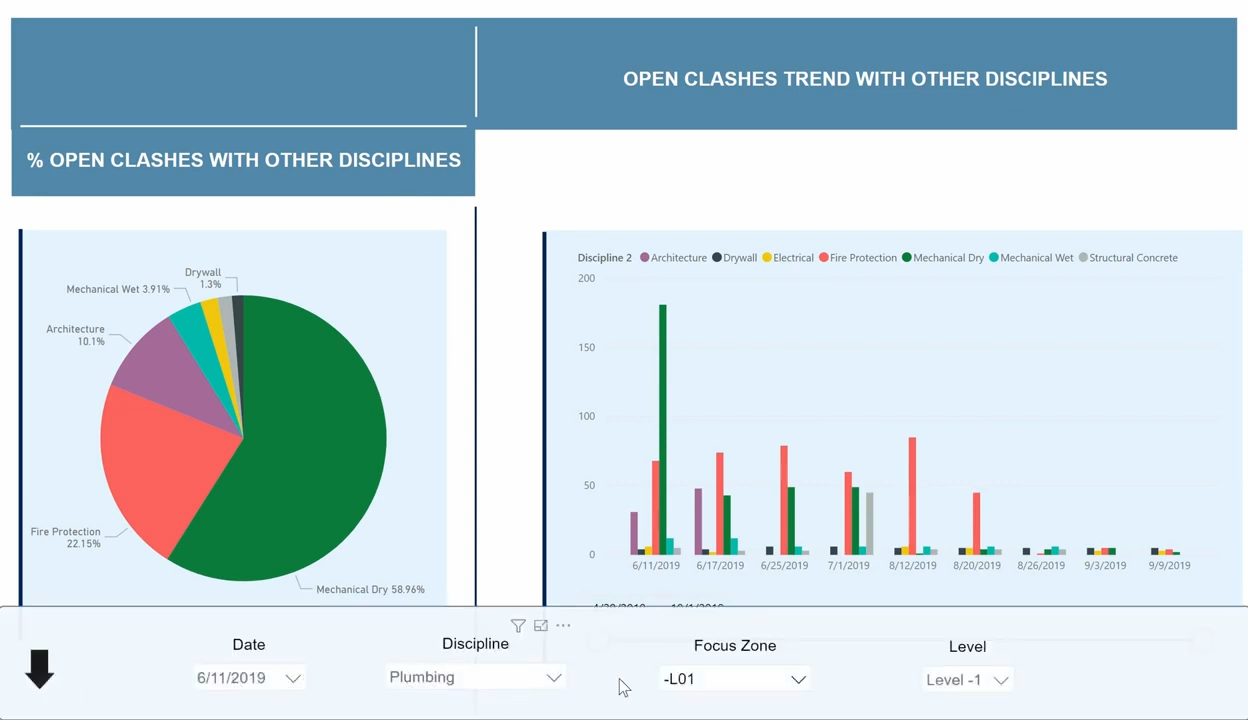
Visualize clash metrics with Navisworks and Power BI – Trade partner status report. ©Carlo Caparas
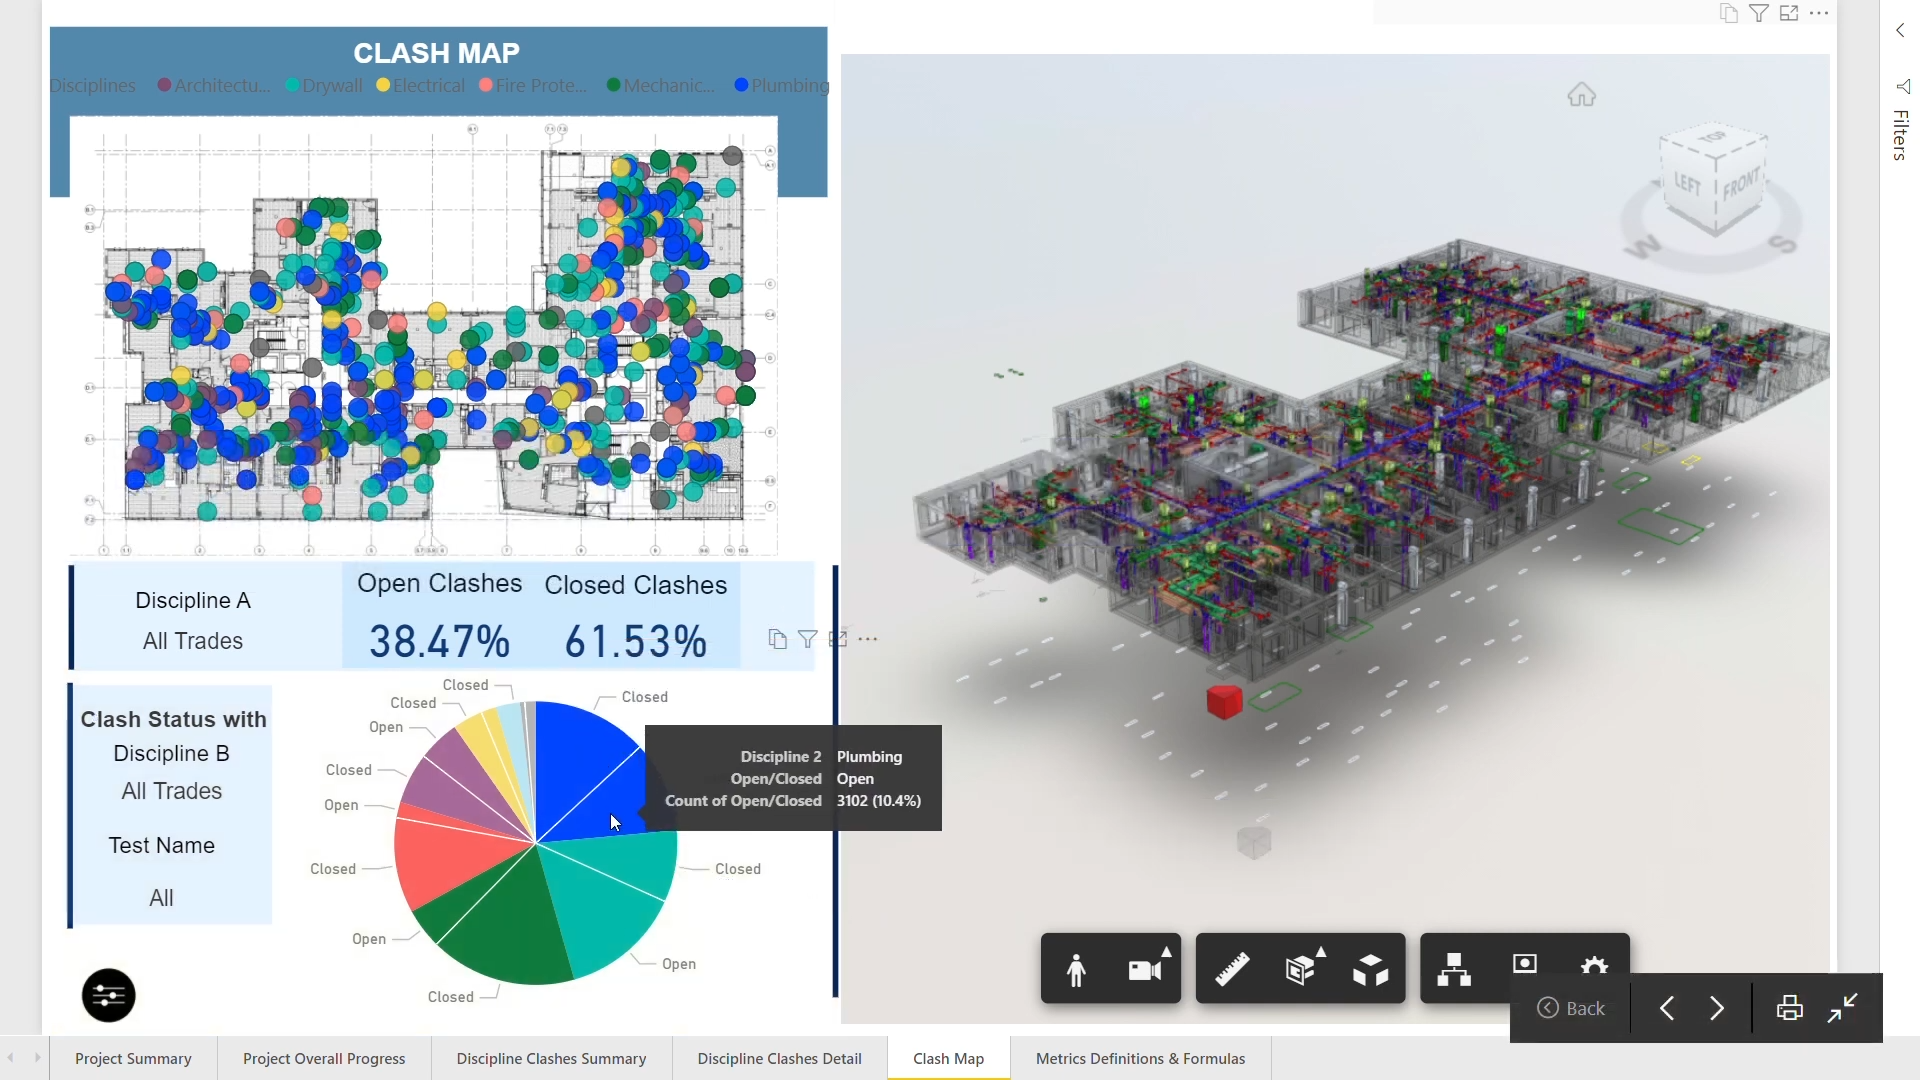
Visualize BIM clash data and metrics – using Power BI and Autodesk Forge – to clearly communicate clash data with project stakeholders in 3D. ©Carlo Caparas
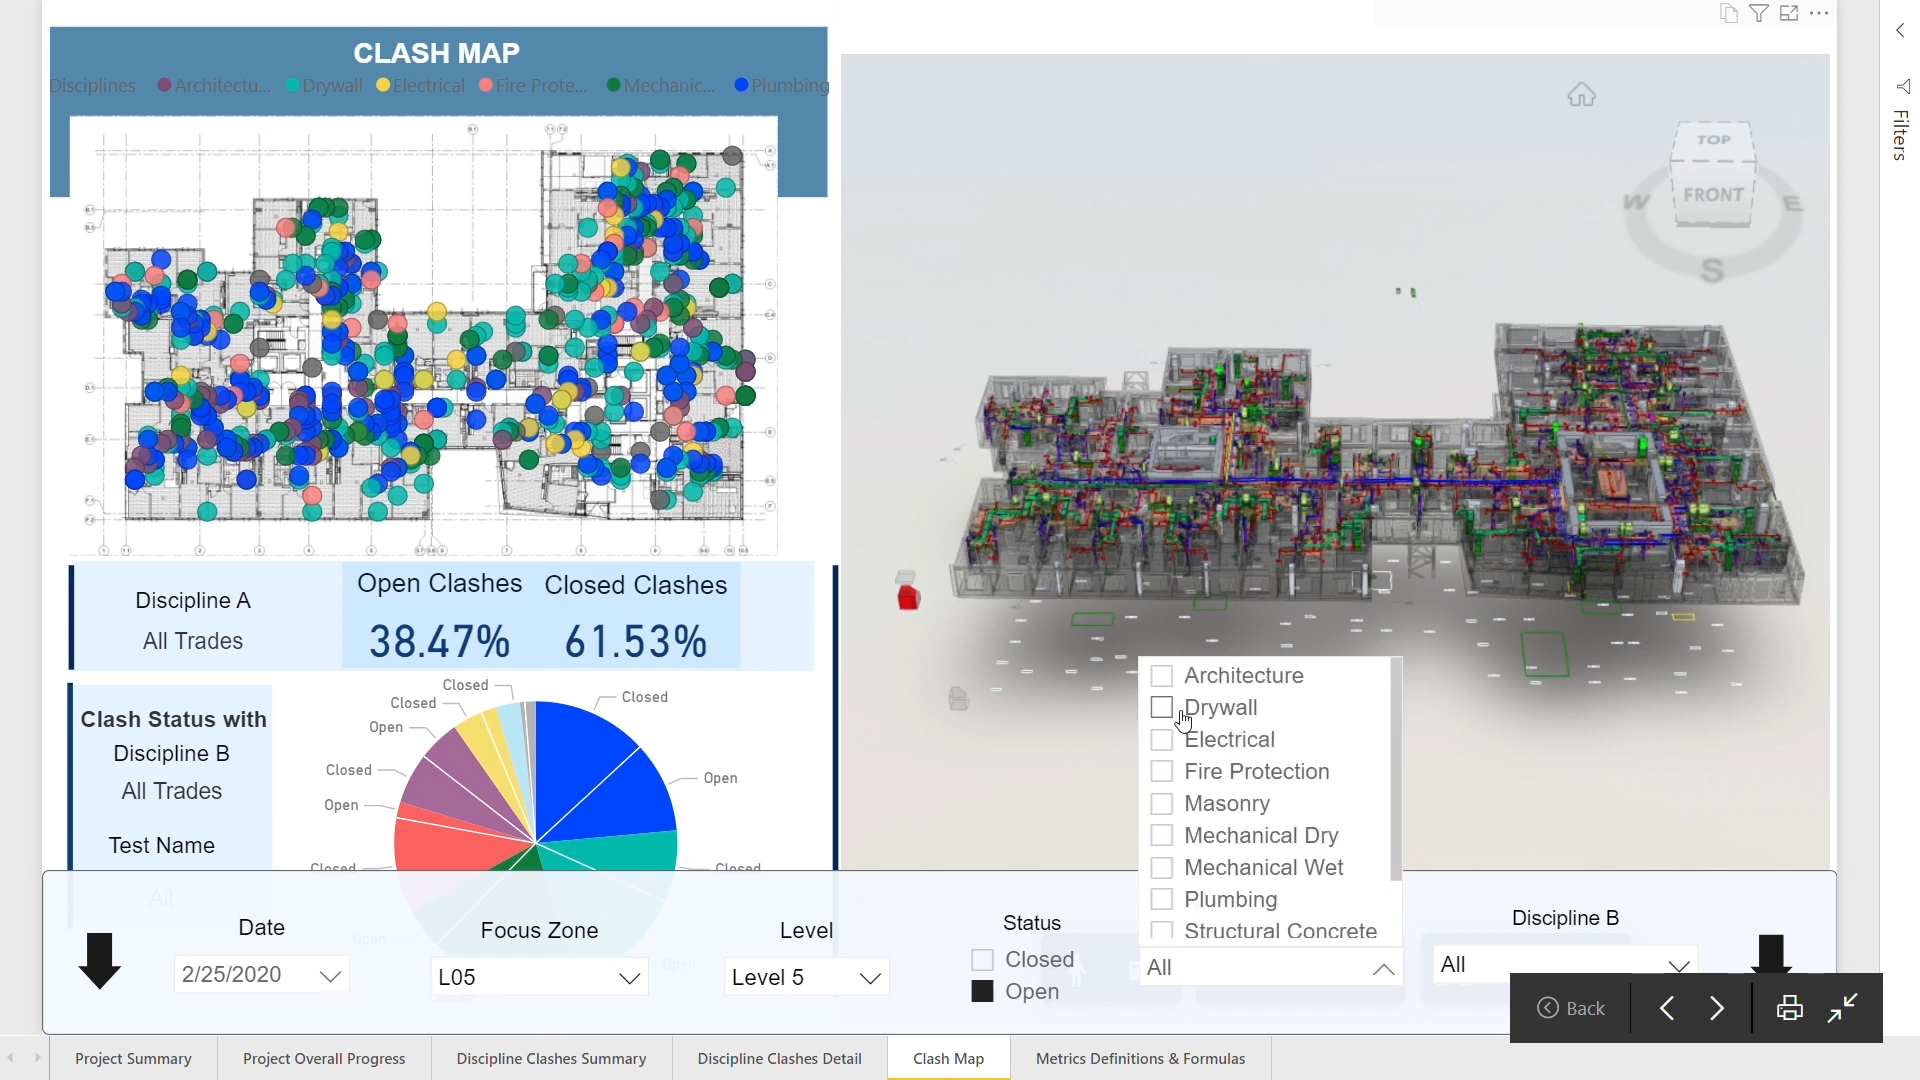
Visualize BIM clash data and metrics – using Power BI and Autodesk Forge – to clearly communicate clash data with project stakeholders in 3D. ©Carlo Caparas
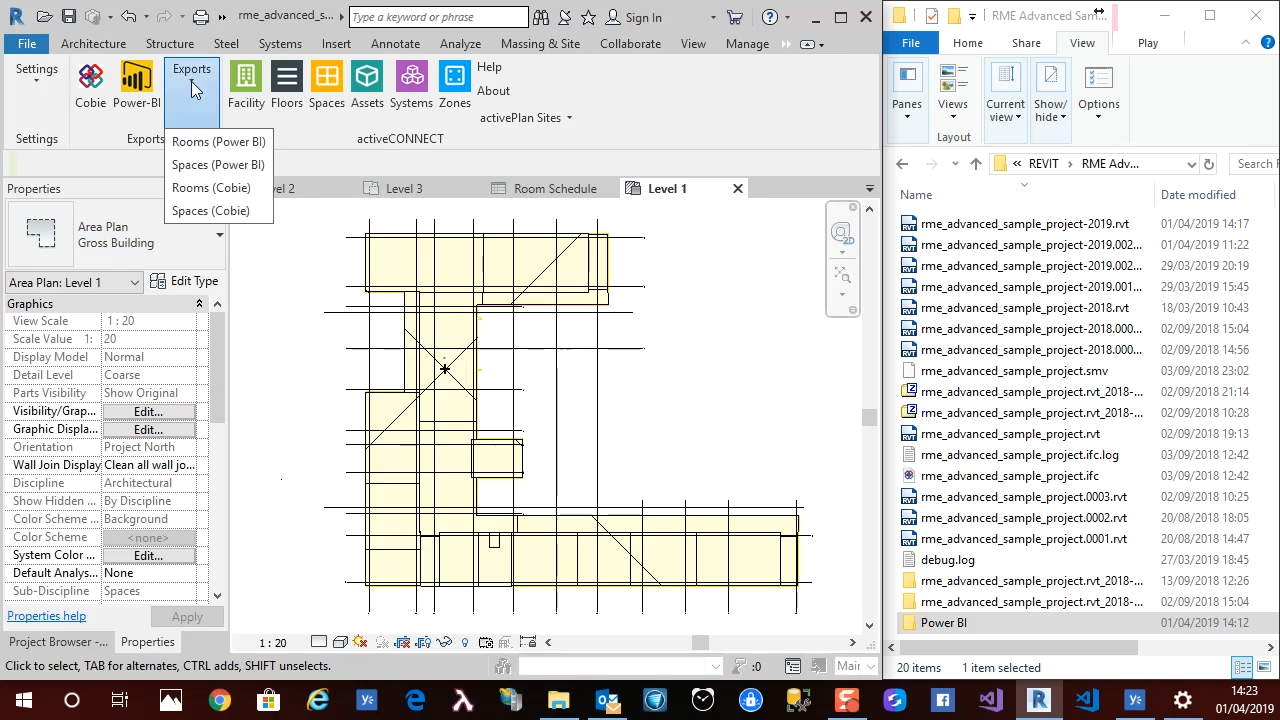
Revit to Power BI – activePLAN toolbar in Revit allows you export the floors that have got rooms/spaces on it individually as an SVG, and to create the Cobie file. ©activePLAN
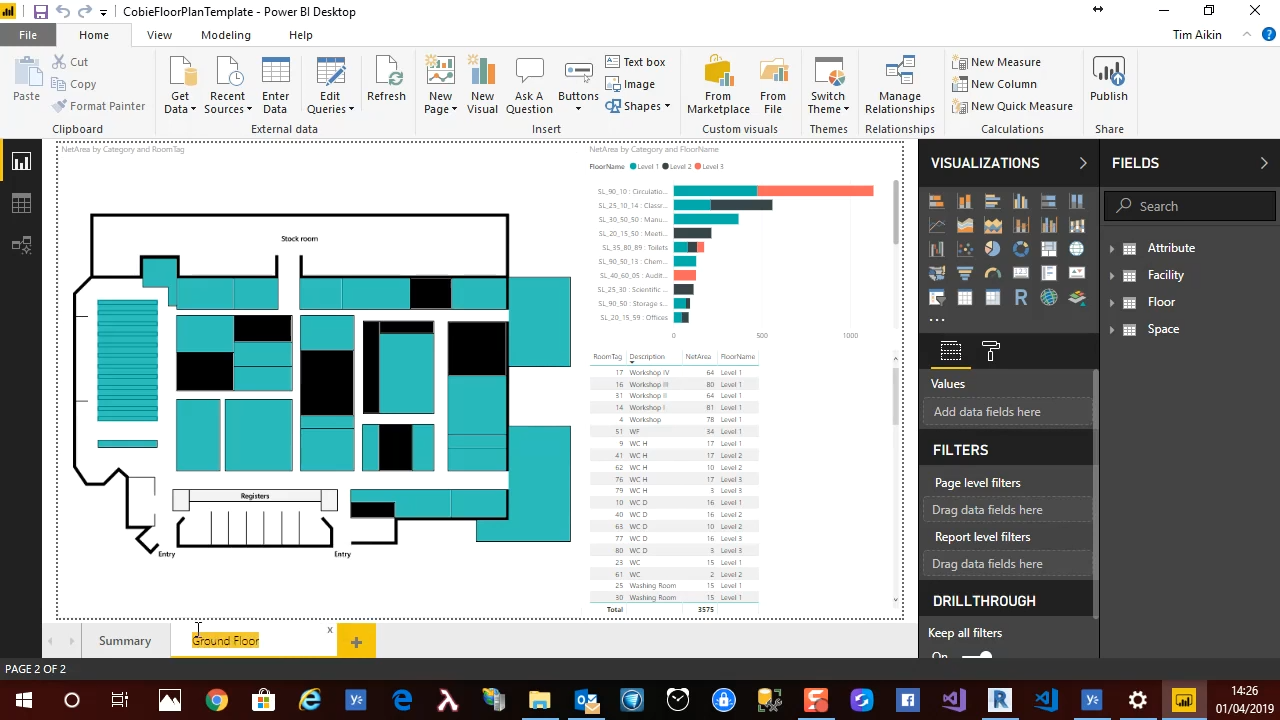
Revit to Power BI – You can create a template in Power BI that you can use for all of your projects. The template is the visualizations without data – you need to attach the data. ©activePLAN
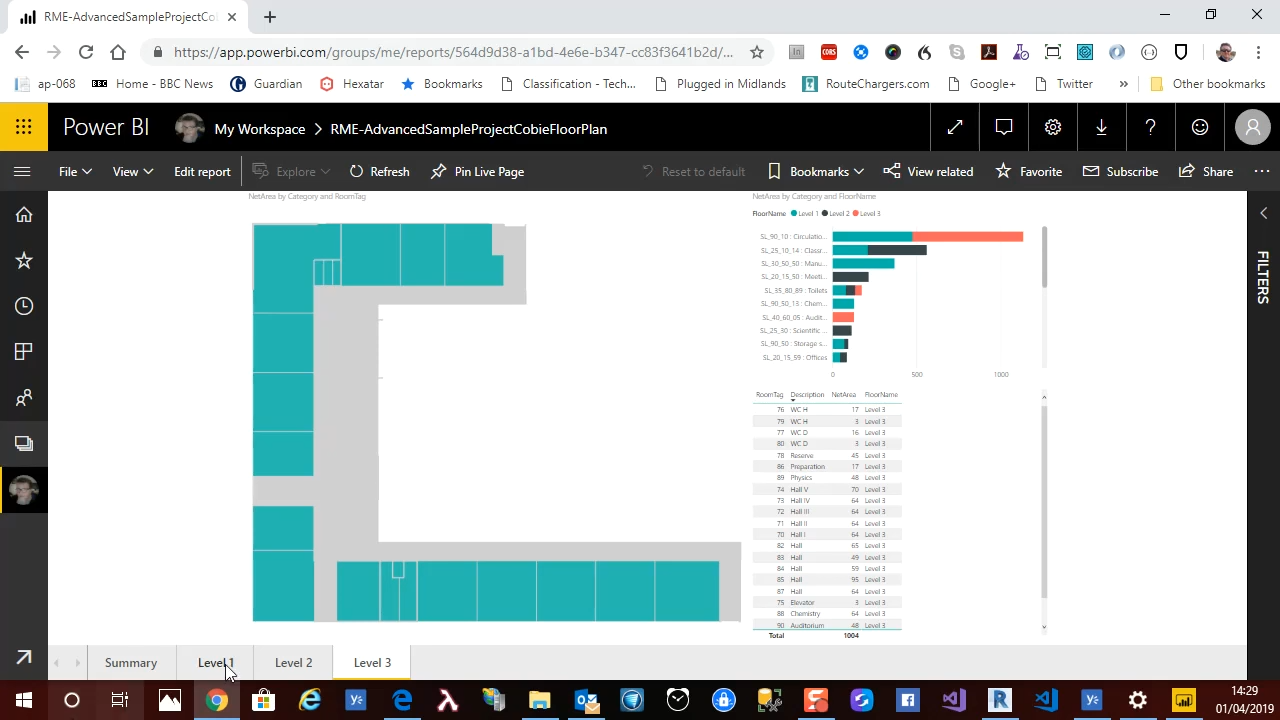
Revit to Power BI – Save PBIX file and publish it to the Power BI cloud website. Then you can create an environment which you can share – the Power BI dashboard – with other people. ©activePLAN
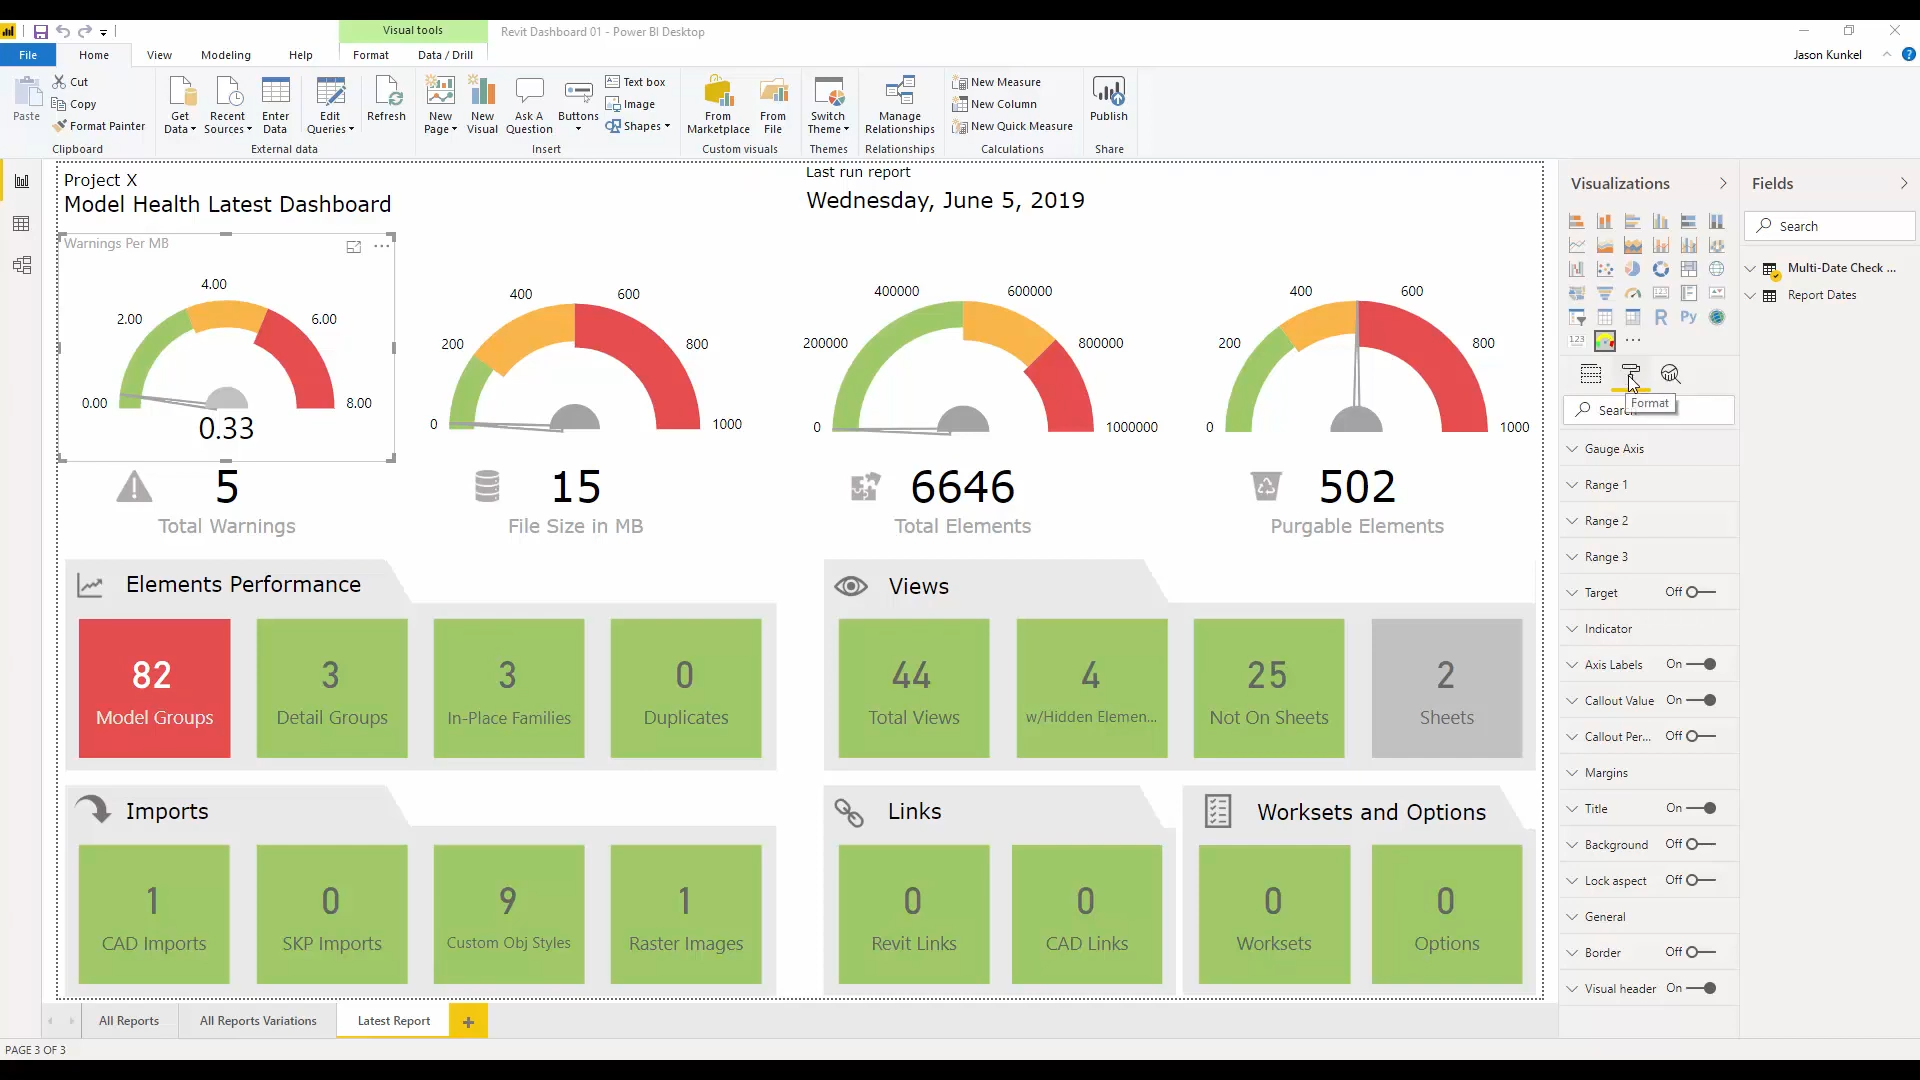
You can use Power BI dashboard to review the health of your Revit model. You need the Model Checker for Revit from Autodesk BIM Interoperability Tools and Power BI dashboard template. Model Checker checkset (called Model Health Dashboard Sample checkset) collects the information from Revit model, and Power BI template creates a Health Dashboard for that Revit model. ©BIM Interoperability Tools
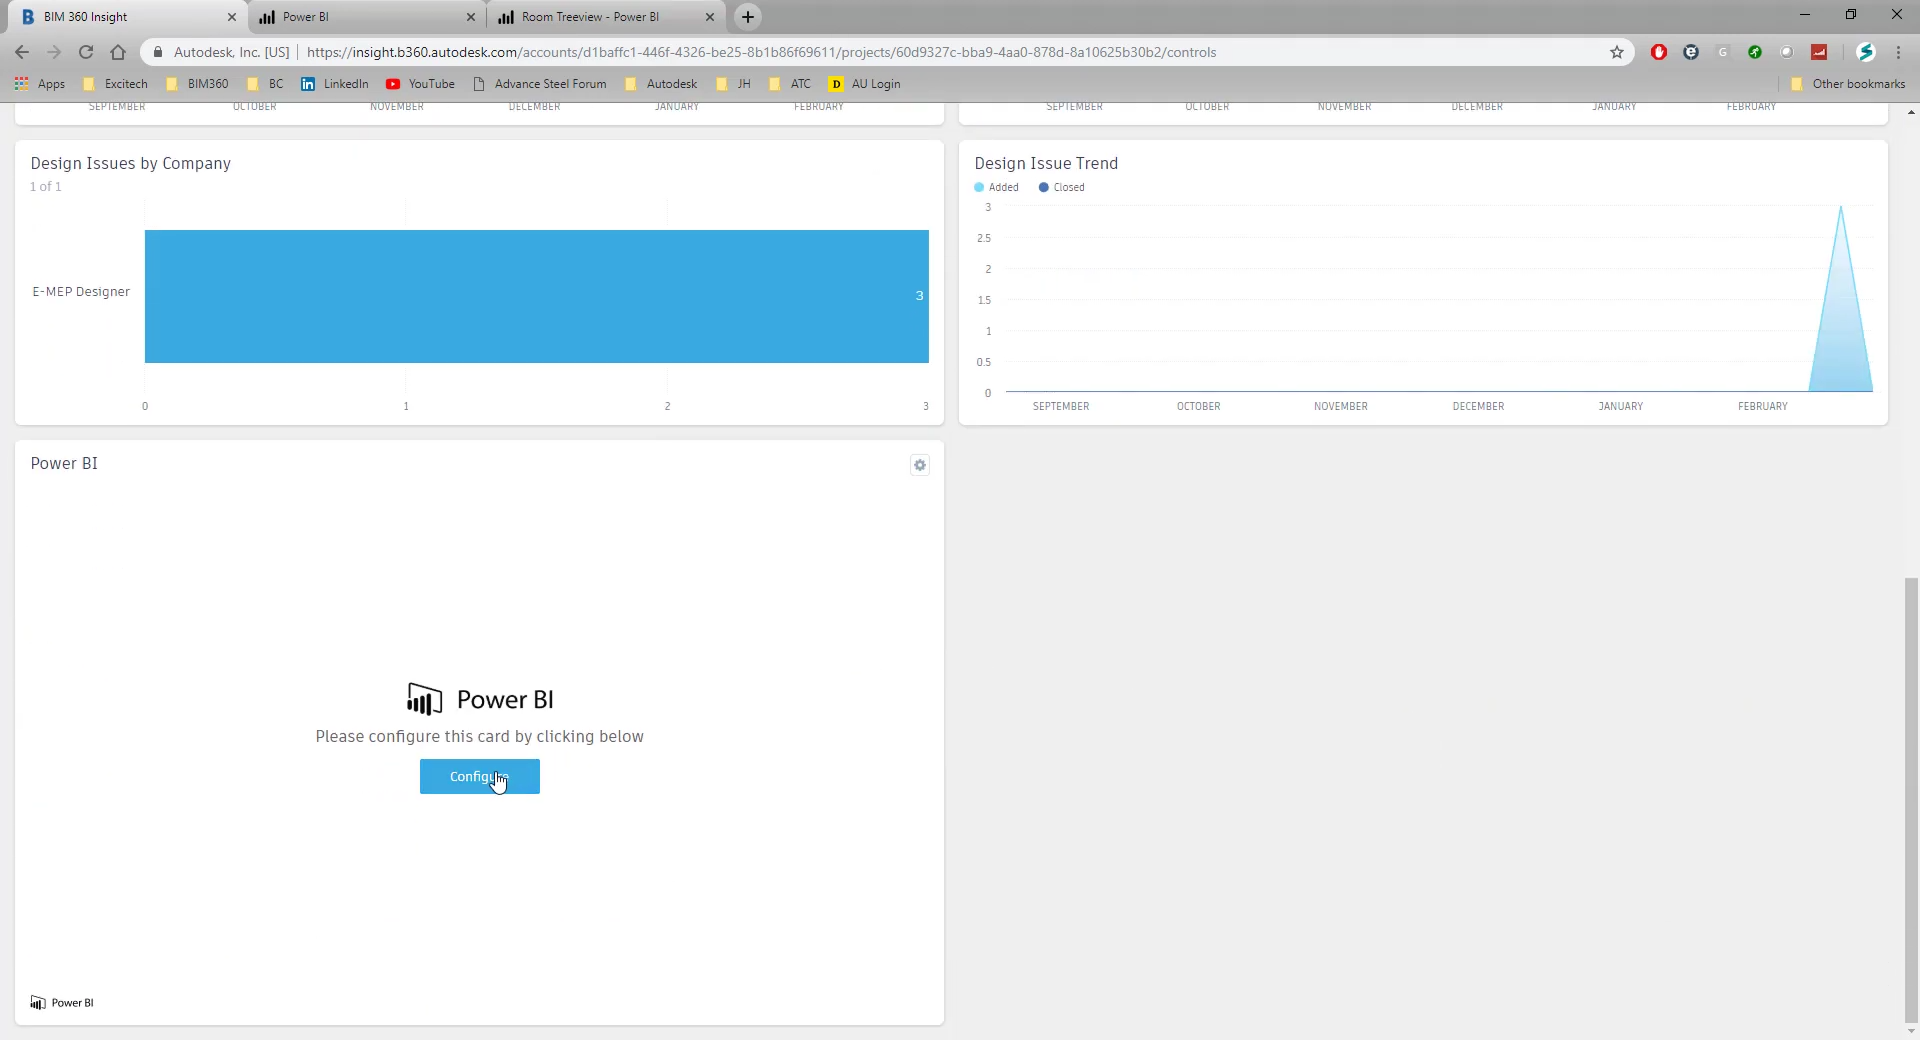
In Insight module of BIM 360 you can add Power BI card from the Card Library, and configure it by entering Card Title and Partner URL. Then you will have a direct link from a Revit to Power BI and BIM 360. ©StructuralBIM
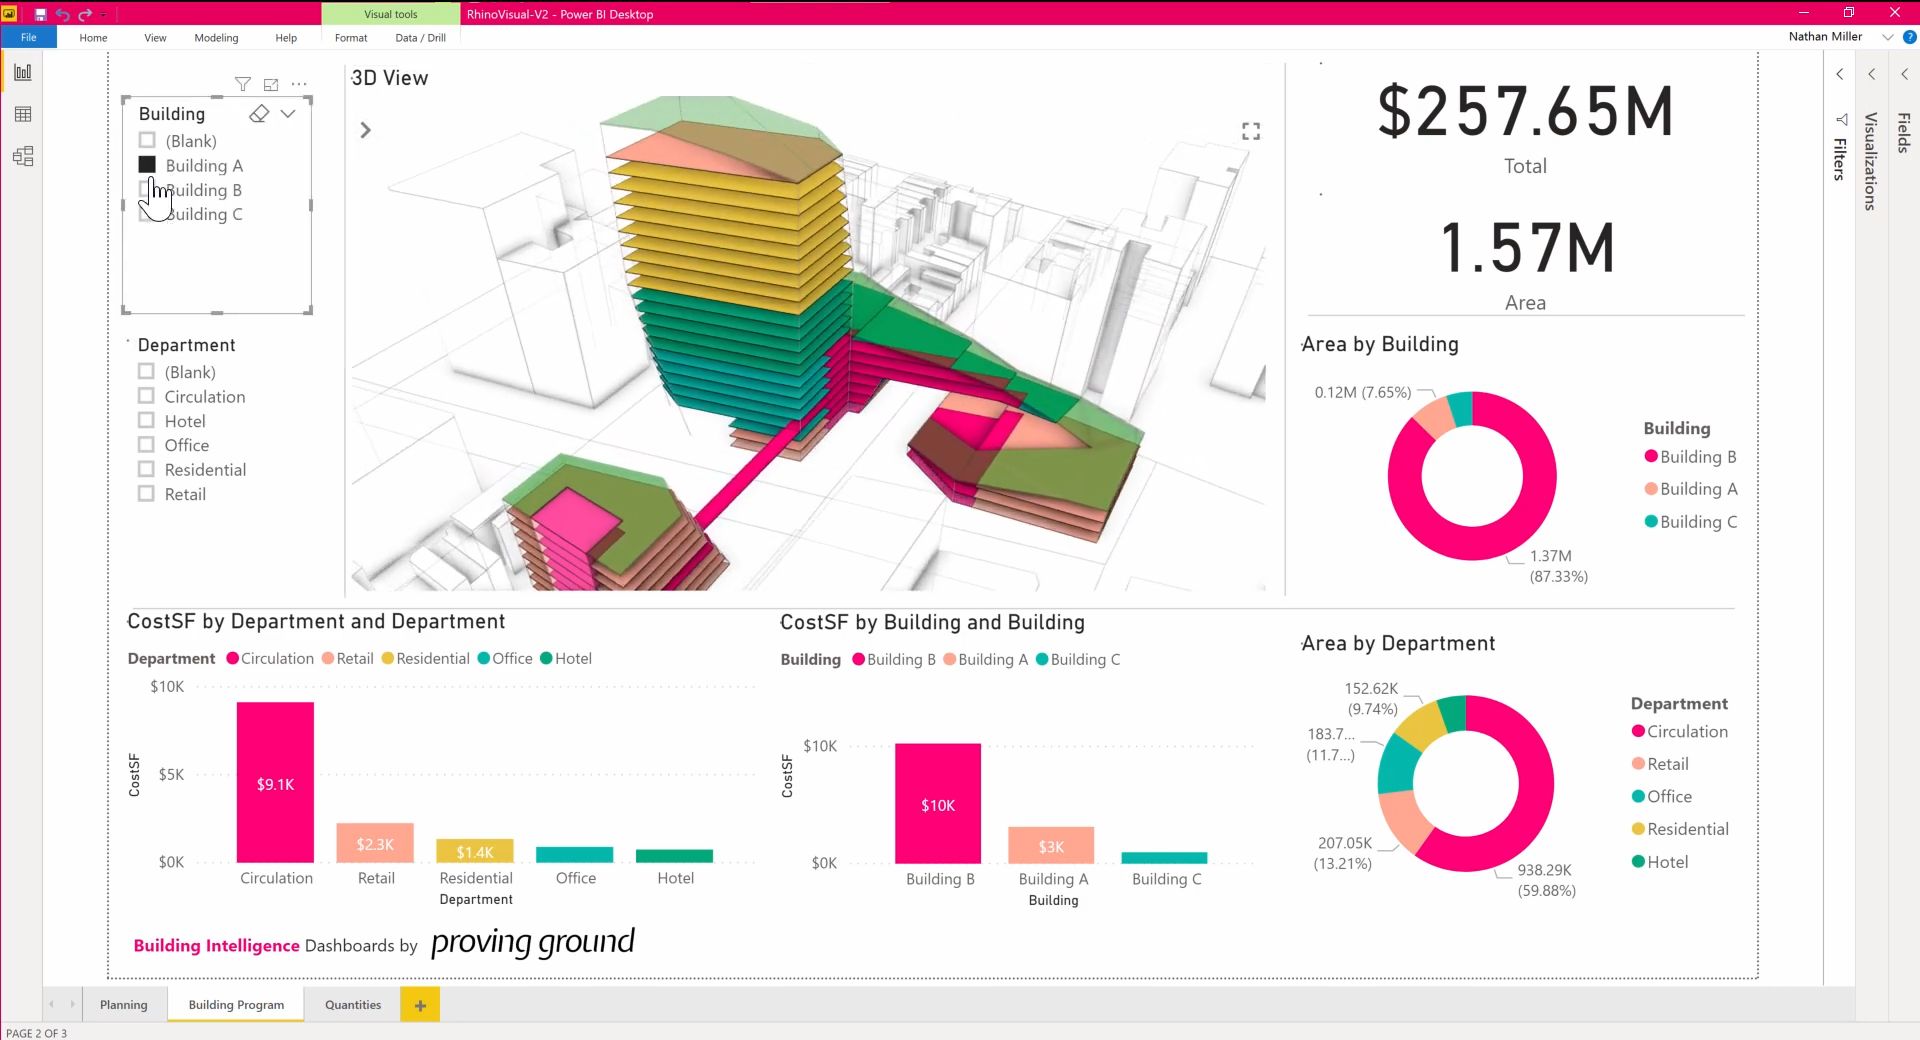
Computed area and cost attributes – Semantic plugin for Rhino supports the integration of 3D geometry and data with Power BI. ©Proving Ground
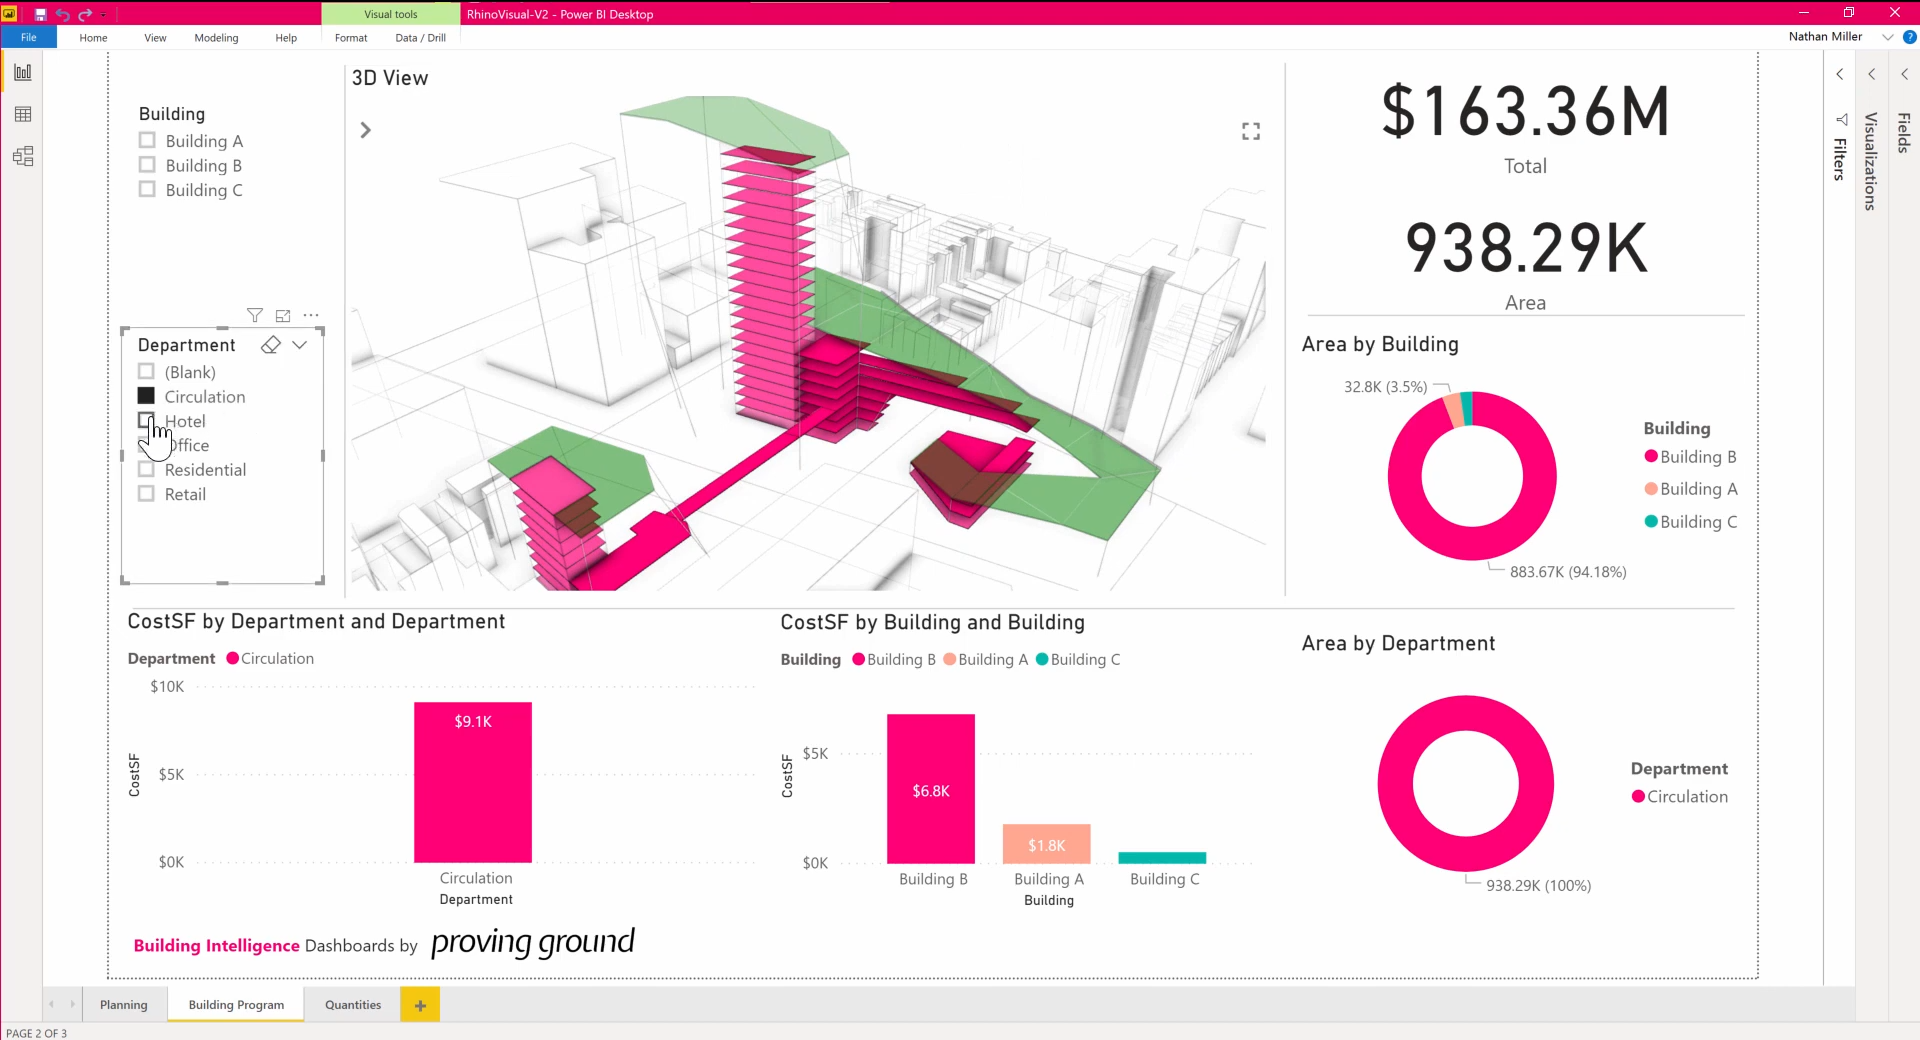
©Proving Ground